Member-only story
20 Useful Excel Functions for Data Analysis
Microsoft Excel is an easy and powerful tool for data analysis. Excel is a widely used software application in industries today, built to generate reports and business insights. Excel contains over 450 functions, with more functions added every year. Here we cover those functions that are mostly used in data analysis.
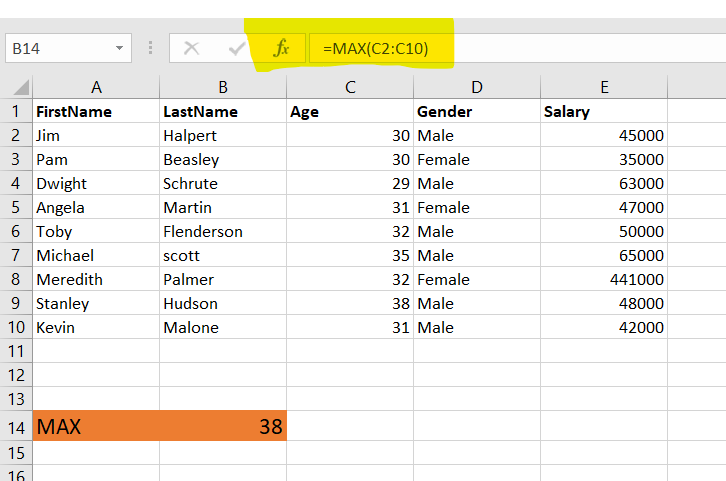
MAX/MIN
The MAX and MIN functions are just what the names imply. MAX will find the largest number in a range, while MIN finds the lowest number in a range.
The formula for this Excel function is:
=MAX(number1, [number2], …)
The formula for this Excel function is:
=MIN(number1, [number2], …)

IF
The IF function tests a condition, and then reacts differently depending on whether the test was true or false.
The formula for this Excel function is:
=IF(test, value_if_true, value_if_false)

IFS
The IFS function checks whether one or more conditions are met, and returns a value that corresponds to the first TRUE condition.
The formula for this Excel function is:
=IFS([Something is True1, Value if True1,Something is True2,Value if True2,Something is True3,Value if True3)

SUM
The SUM function, as the name suggests, gives the total of the selected range of cell values. It performs the mathematical operation which is addition.